The Cost of Capital
MGMT 648 · October 10
Sat Oct 10, 2026
The weighted average cost of capital
Free cash flow is what the business produces before any payment to investors. Both claims have a share of it, so the discount rate is the average of the two required returns, weighted by how much of the firm each one finances.
Discounting free cash flow at the WACC gives enterprise value. Subtract net debt for the value of the equity.
The five inputs
| Input | What it is | Where it comes from |
|---|---|---|
| Market value of equity | Share price times shares outstanding | |
| Market value of debt | Usually book debt, including finance leases | |
| Cost of equity | Usually the CAPM | |
| Cost of debt | Usually yield on similarly rated bonds | |
| Tax rate | Tax provision over pretax income |
Market values, not book values
The weights are what the market says the two claims are worth now. Walmart’s book equity is $100 billion and its market capitalization is $861 billion, so the two sets of weights are nowhere near each other.
Debt is the exception in practice. Firms do not report the market value of their debt, and it stays close to book unless rates have moved a long way since the bonds were issued or the firm is in trouble, so book debt stands in.
Finance lease obligations are debt. Walmart’s $67.1 billion of total debt includes $22.3 billion of them.
The tax term
Interest is deducted from taxable income, so a dollar of interest costs the firm dollars. Walmart’s tax provision was 24.4% of pretax income, which turns a 5.80% cost of debt into 4.38% after tax.
Free cash flow is computed as if the firm had no debt, so the interest deduction never appears in the cash flows. The WACC is where it enters the valuation.
Walmart’s weights
92.8% equity
7.2% debt
24.4% tax rate
$861 billion of equity against $67.1 billion of debt, on October 6, 2026. That leaves and , which are the next two sections.
What the formula assumes
The weights hold
The firm keeps financing itself in the same proportions. Changing leverage moves the weights and at the same time, in opposite directions.
The project has the firm’s risk
A rate built from the firm’s beta prices a project whose cash flows move with the market the way the firm’s do. A division that does not gets its own rate.
What debt costs
Treasury yields, ratings, and spreads.
Treasury yields this century
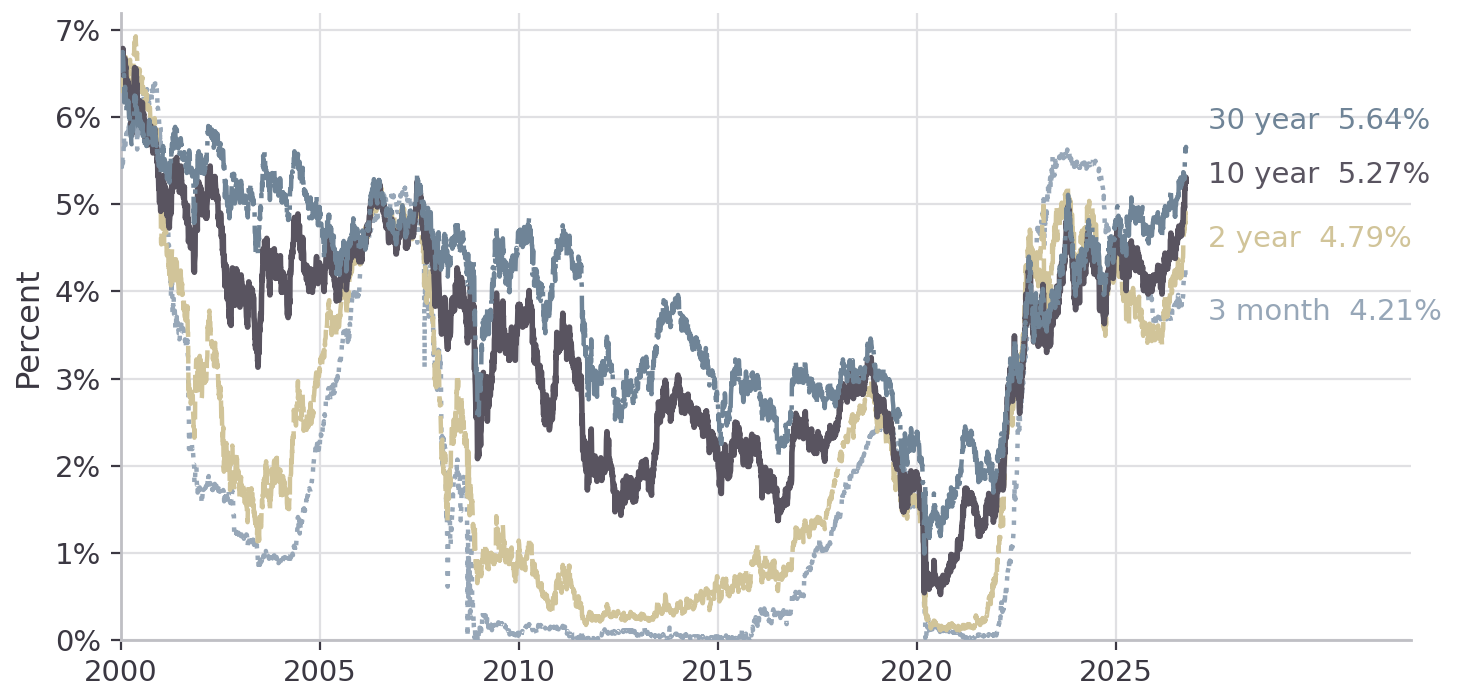
The curve on October 6
| Maturity | Yield | Low since 2000 | High since 2000 |
|---|---|---|---|
| 3 month | 4.21% | 0.00%, December 2008 | 6.42%, November 2000 |
| 2 year | 4.79% | 0.09%, February 2021 | 6.93%, May 2000 |
| 10 year | 5.27% | 0.52%, August 2020 | 6.79%, January 2000 |
| 30 year | 5.64% | 0.99%, March 2020 | 6.75%, January 2000 |
For the cost of debt, match the maturity to the life of the cash flows: a company’s long-dated bonds price off the long end of this curve. The risk-free rate in the CAPM is a separate choice, and this deck uses the 3-month bill, because that is the rate the market risk premium is measured over.
Credit ratings
| Moody’s | S&P and Fitch | |
|---|---|---|
| Aaa, Aa, A, Baa | AAA, AA, A, BBB | Investment grade |
| Ba, B, Caa, Ca, C | BB, B, CCC, CC, C | High yield |
Many institutions are barred from holding non-investment-grade debt.
Walmart is Aa2 at Moody’s and AA at S&P.
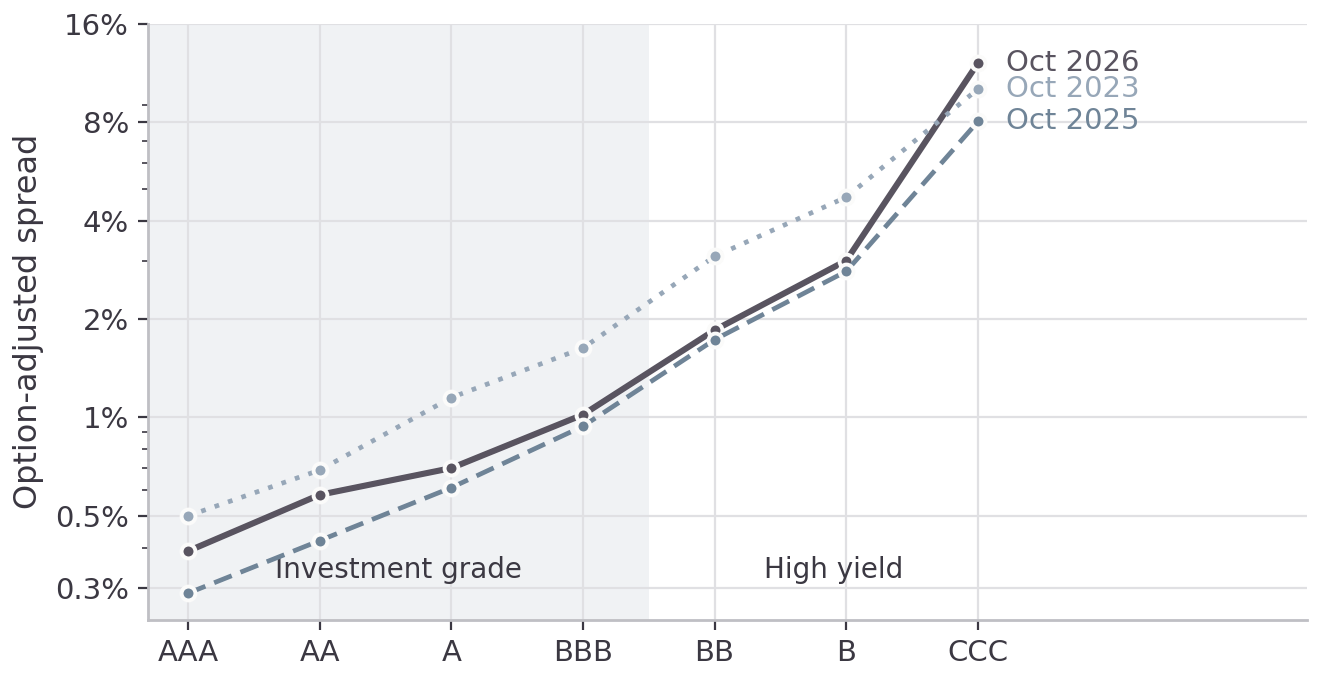
Spreads on October 6
| Rating | Spread | Yield | Rating | Spread | Yield | |
|---|---|---|---|---|---|---|
| AAA | 0.39% | 5.82% | BB | 1.85% | 6.87% | |
| AA | 0.58% | 5.80% | B | 3.02% | 8.02% | |
| A | 0.70% | 5.84% | CCC | 12.14% | 16.98% | |
| BBB | 1.02% | 6.19% |
ICE BofA index spreads and yields, from FRED. The spread is option-adjusted and quoted over a Treasury. Different maturity Treasuries may be used for different rating classes.
The shape of the credit curve
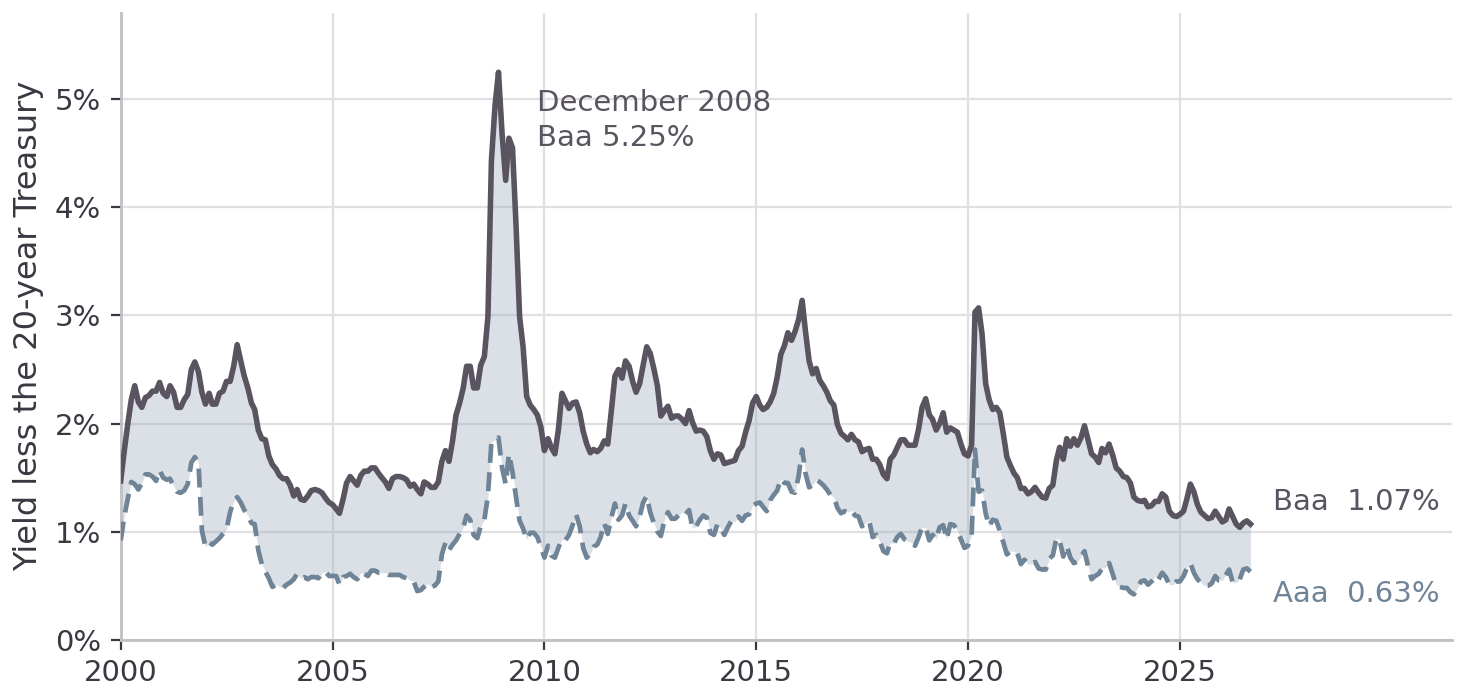
Twenty-six years of the Baa spread
The promised yield and the expected return
A bond’s yield is the return if the issuer makes every payment. The expected return is lower:
Using the yield in place of overstates the cost of debt by that product. At AA the correction is a few basis points. At the 12.14% CCC spread it is much larger.
The CAPM
Everyone computes the same tangency portfolio
Give every investor the same means, variances and covariances, and the same rate to lend and borrow at, and they all solve the problem from the first half of today and get the same answer. They differ only in how much of that portfolio they hold against bills.
Every share is held by someone, so adding up across investors makes the tangency portfolio the market portfolio.
The tangency portfolios for the sector funds short three of the nine sectors, and the market portfolio shorts nothing. In equilibrium expected returns adjust until the tangency portfolio is the market; the sample means that produced those shorts are not equilibrium expected returns.
What that says about one asset
An asset’s weight in the tangency portfolio depends on its excess return relative to its covariance with the portfolio. Making the market that portfolio turns the condition into a statement about every asset at once:
An asset’s own standard deviation is not in the equation. Only the part of its risk that moves with the market is priced.
Beta is a regression slope
The ratio of a covariance to a variance is the slope coefficient from a regression, which gives a way to estimate from returns:
The CAPM says , so a test of the model is a test of whether the intercept is zero, and an estimate of the cost of equity uses the slope and ignores the intercept.
What the residual carries
is the share of the asset’s variance that comes from the market, and is the share that is potentially diversifiable. The CAPM pays nothing for the second part.
For Walmart over the last five years is 0.20. Four fifths of the month-to-month movement in Walmart’s return has nothing to do with the market.
Yahoo Finance and the French data library
Yahoo Finance
Daily and monthly prices for anything with a ticker, adjusted for splits and dividends, back to the listing date. No account and no key. The yfinance package wraps it. Percent changes in the adjusted prices are returns.
Ken French’s data library
Monthly and daily returns on the market, the risk-free rate, and the factor and portfolio returns behind forty years of asset pricing research, from July 1926. Hosted at Dartmouth, managed by DFA, and read by pandas_datareader.
It is conventional to use the past 60 monthly returns in the CAPM regression.
Walmart against the market
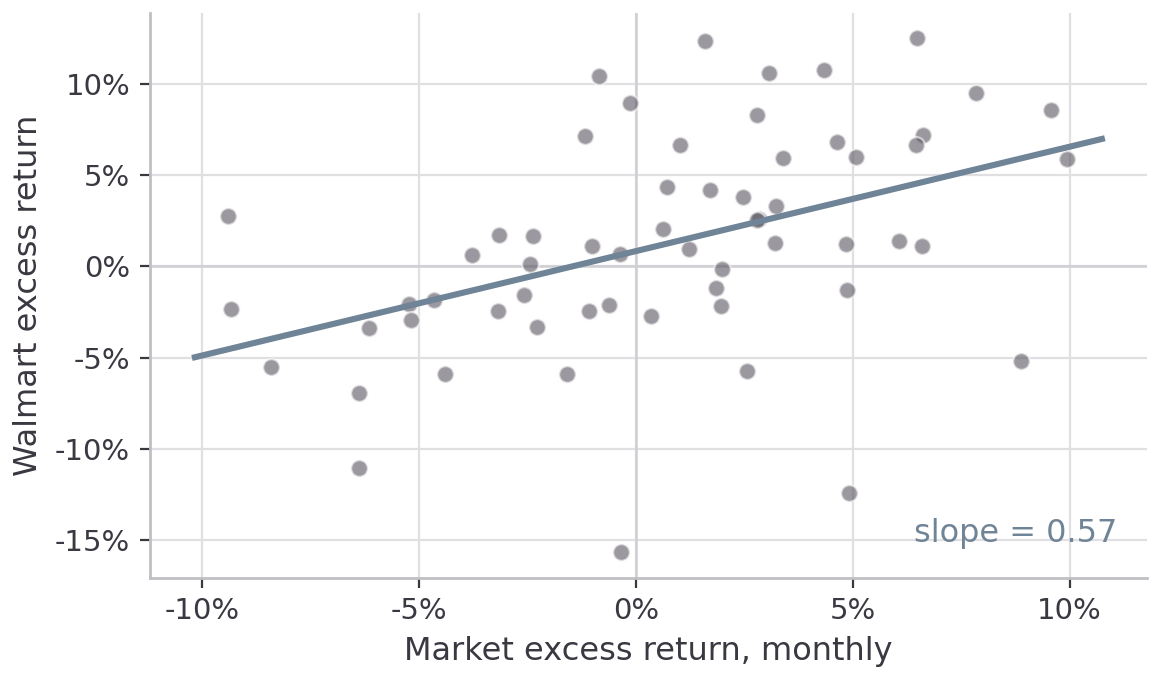
Sixty months to August 2026
0.57 beta, standard error 0.15
0.20
+9.9% alpha a year
The 95% interval for beta runs from 0.27 to 0.87. Alpha’s standard error is 8.5 points a year, so the intercept is not distinguishable from zero.
Yahoo Finance reports 0.578 for Walmart, from its own five years of months.
Five betas
| Ticker | Beta | Standard error | |
|---|---|---|---|
| KO, Coca-Cola | 0.29 | 0.13 | 0.08 |
| WMT, Walmart | 0.57 | 0.15 | 0.20 |
| JPM, JPMorgan | 0.99 | 0.14 | 0.45 |
| PLTR, Palantir | 1.71 | 0.58 | 0.13 |
| NVDA, Nvidia | 2.17 | 0.30 | 0.48 |
Sixty months to August 2026. Palantir’s standard error is as wide as Walmart’s whole beta, so the interval around 1.71 runs from 0.56 to 2.85.
The market risk premium
The other part of the cost of equity.
A hundred years of the market factor
8.35% average, annualized
18.37% standard deviation
4.75% to 11.94% 95% interval
1,202 months of Mkt-RF, July 1926 through August 2026. The standard error is with in years: .
The same arithmetic as the interval for SPY earlier today, with a century of data instead of twenty-one years.
The average through each date
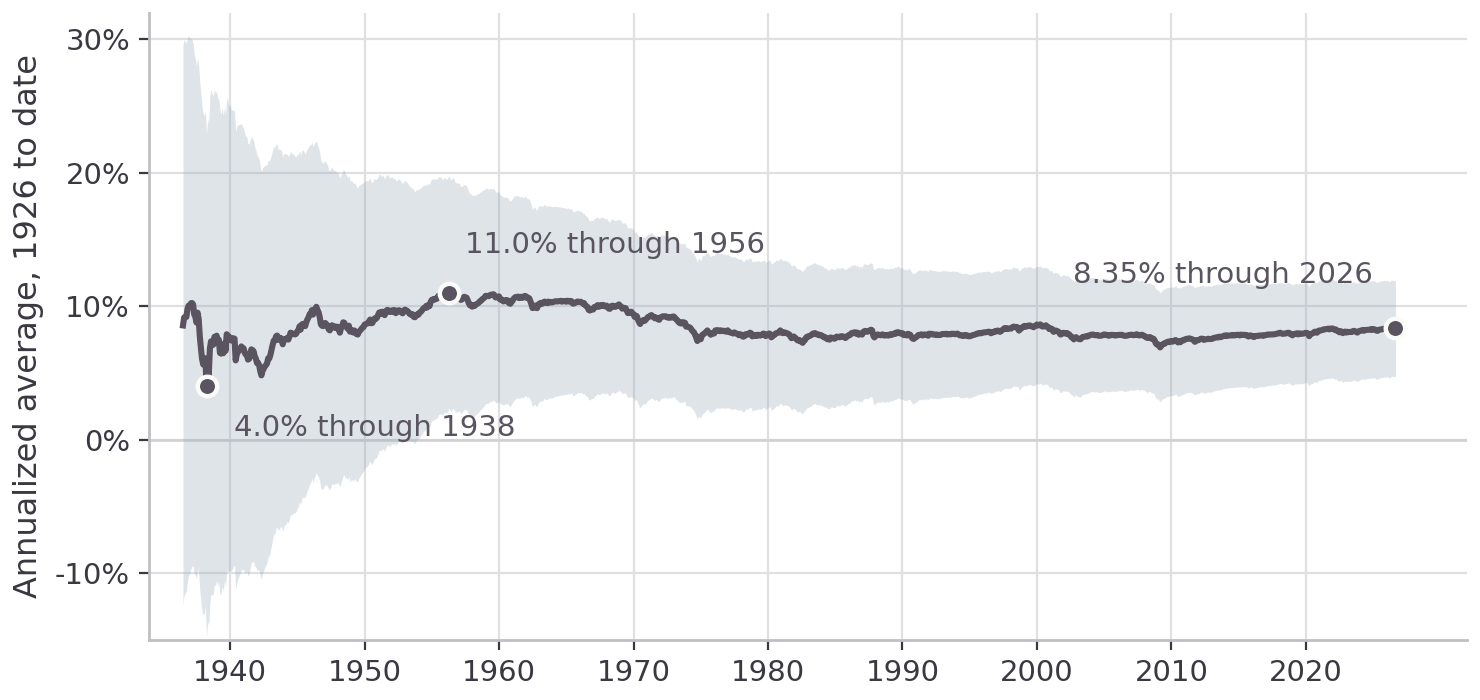
The expanding window
Each point is the average from July 1926 through that month, annualized, with its 95% interval around it. The series starts in June 1936, the first month with ten years behind it.
The estimate has run from 4.0% in 1938 to 11.0% in 1956 and sits at 8.35% now.
Walmart’s cost of capital
| Value | Where it came from | |
|---|---|---|
| Risk-free rate | 4.21% | 3-month Treasury, October 6 |
| Market risk premium | 8.35% | 1926 to 2026, annualized |
| Beta | 0.57 | 60 months to August 2026 |
| Cost of equity | 8.97% | |
| Cost of debt, after tax | 4.38% | |
| WACC | 8.64% |
The premium is measured against the one-month bill, so the bill rate keeps both terms of the cost of equity on the same basis. A 10-year yield instead would add a point to the cost of equity while pairing that premium with a different risk-free rate.
Your company’s cost of capital
The regression
Sixty months of your company against Mkt-RF. Report beta, its standard error, and .
The weights
Market capitalization, total debt including leases, and the tax provision over pretax income.
The rate
A cost of debt from the rating and the spread table, with the 3-month bill and the 8.35% premium. If your company has no rated debt, pick the rating its interest expense over average debt implies and say which one you picked.
MGMT 648 · Applied Finance